
A new report from CoreLogic identifies 14 of the top 100 markets in the U.S. as currently overvalued, double the number as of the end of the first quarter 2015.
CoreLogic’s Market Condition Indicators says that Texas has the largest number of overvalued markets, with five of its six top markets identified as overvalued. The Market Condition Indicators evaluate whether individual markets are undervalued, at value, or overvalued based on the market’s real disposable income per capita.
The analysis expects the national housing market to remain within the normal range (+/- 10%) of the long-term sustainable level through 2017, with most of the top 100 markets at value.
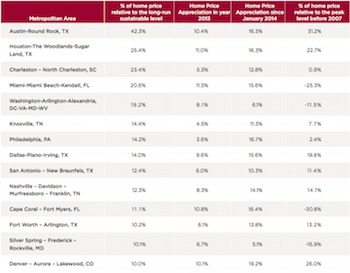
Home prices in five Texas markets are well above their historical peak levels partly due to strong job growth and to the absence of the severe boom-bust housing cycle that was seen elsewhere.
Between 2006 and 2014, an oil and gas boom had fueled job and population growth in some markets, pushing home prices well above their sustainable levels in these markets.
Since last year, geopolitical events have shifted in favor of excess oil supply, possibly exerting further downward pressure on oil prices in the next few years and impacting some of these Texas markets. The areas that have become overvalued since last quarter are: Cape Coral, Fla., two Tennessee markets, Knoxville and Nashville – Davidson – Murfreesboro – Franklin, philadelphia, Silver Spring–Frederick–rockville metro in Maryland and Denver–aurora–Lakewood in Colorado. as home prices have risen significantly since 2013, homes have become less affordable, and therefore, home prices less sustainable.

(Source: CoreLogic)
During the bubble years of 2005 through 2007, home prices were more than 10% above the long-run sustainable levels. During the market collapse, home prices quickly fell more than 10% below the sustainable price during late 2010 and early 2013. Subsequently, as home prices have continued to rise, the gap has narrowed to 3.6% below the long-run sustainable level in June 2015 and is expected to remain within the normal range through the end of 2017, with the gap forecasted to shrink further to 1.5%.